Missing Migrants Project
Python-coded analyses of the Missing Migrants dataset (IOM) and Tableau visualization.
Objective:
Exploratory and advanced analytics of the Missing Migrants dataset to gather information about the lethal dangers of migration and to educate a public audience interested in a facts-based understanding of migration.Key Business Questions:
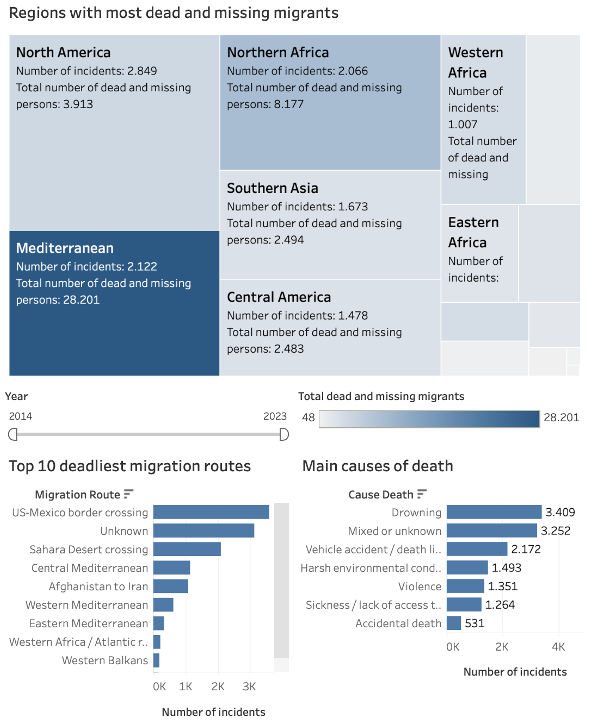
- Where are the "hotspots" of migration deaths?
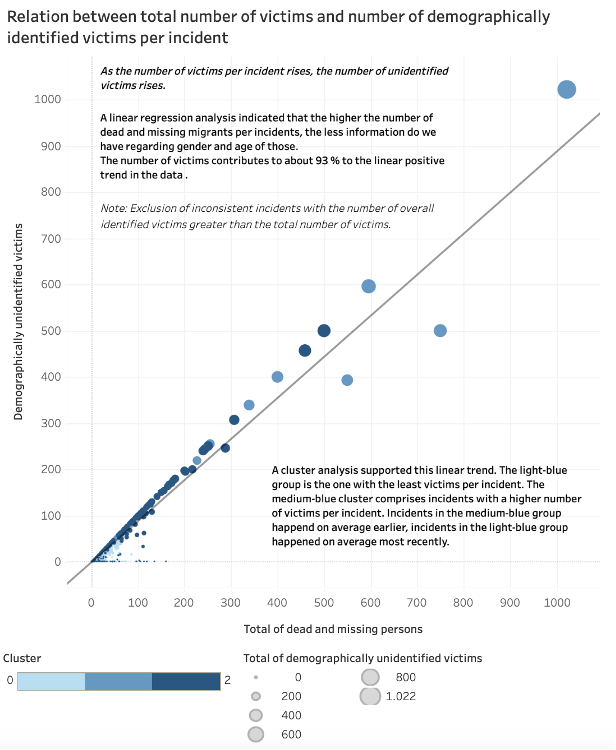
- How many migrants can be identified in terms of demographics?
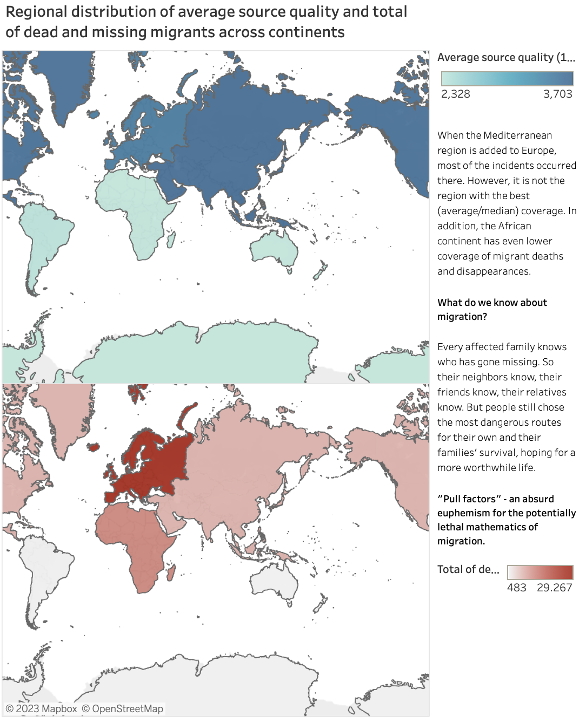
- Are places with high coverage also the ones who record most deaths?


Data
Open-source dataset from the INTERNATIONAL ORGANIZATION FOR MIGRATION (IOM):
Procedures
- Python:
- Data wrangling & merging
- Deriving variables
- Un-/Supervised Machine Learning
- Geospatial and Time Series Analysis
- Tableau visualization
Exploring the Dataset & Deriving Questions:

Since 2014, at least 59,217 migrants died or disappeared on migration routes. North America, the Mediterranean Sea, and Northern Africa are the hotspots of migration deaths and disappearing; with the US-Mexico border, the Sahara Desert, and central Mediterranean Sea as the deadliest routes. Drowning is among the main causes of death. ”Unknown” is a common category across all variables in the dataset – What do we really know?
Machine Learning Analyses:

Supervised regression and unsupervised clustering machine learning algorithms indicated that a direct positive relation exists between the number of victims per incident and the number of demographically unidentified victims per incident.
Geospatial Analysis:

Pointed out that the region "Mediterranean" includes incidents on European and North African territory - due to the data structure, the limitations of the current project did not allow for further data processing yet. However, since the destination of migrants is Europe, the incidents were attributed to Europe. When "Mediterranean" is added to Europe, the total number of deaths is highest there. However, it is not the region with the best (average/median) coverage.
Time Series & Forecasting Analysis:

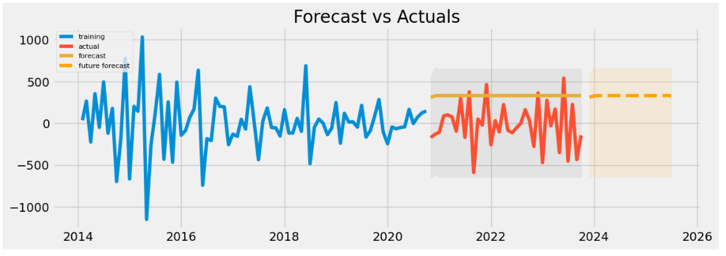
This plot‘s dashed orange line represents the forecasted values for the future, and the shaded area represents the confidence intervals for the future forecast. The total number of deaths and missing is expected to remain at a high level of approximately 400 deaths and missing per month for the next 20 months. Time Series & Forecasting Analysis indicate that people will continue to migrate in search of a better life, despite deadly risks. Data collection and analysis to overcome the lethality of migration is essential for a fact-based, humanistic policy to combat this tragedy.
Missing Migrants: What we do know is way less than what we don't know. Numbers are most likely an undercount. So many incidents go uncounted, so many victims go unidentified.
Find the complete project repository including all Jupyter Notebooks here:

Future approach/ improvements:
Time restrictions limited the data cleaning and wrangling process and thereby, the possibility of variables to analyze in conjunction. To further advance the project, I will refine the data preparation process and extend the analyses.