Casestudy: Instacart Groceries Basket Analysis
An online grocery store demands an initial data and exploratory analysis to uncover information about sales patterns and suggest strategies for better customer segmentation. Instacart stakeholders are most interested in the variety of customers in their database along with their purchasing behaviors. They want to target different customers with applicable marketing campaigns to see whether they have an effect on the sale of their products. My analysis informs this strategy to ensure Instacart targets the right customer profiles with the appropriate products.

Purpose & Context:
- To provide data-driven, business-ready recommendations and solutions
- To explore the possibilities and challenges of coding with Python
- To become acquainted with Jupyter Notebook and important business standard libraries
Objective:
Problem:
Instacart’s “one fits all” approach towards customer marketing campaigns - Diverse demographics and preferences of their customers demand for targeted marketing campaigns.Solution:
To provide Instacart with information on their sales patterns - Suggest strategies for better marketing segmentation: Ensure Instacart targets the right customer profiles with the appropriate products.Challenge:
To derive specific information about customers from different data sets to inform targeted marketing.
How long did it take?
- Learn from scratch, develop, and apply technical skills
- To explore the possibilities and challenges of coding with Python … within 6 days
- Final project deliverable: … within 1 1/2 day

Who & what was involved?
Skills & Methodologies:
- Data wrangling & merging
- Deriving variables
- Grouping & aggregating data
- Visualizing in Python
- Reporting in Excel
- Population flows
1. The Analysis: Data & Key Questions
The datasets
Open-source datasets from Instacart:- Busiest days/ hours
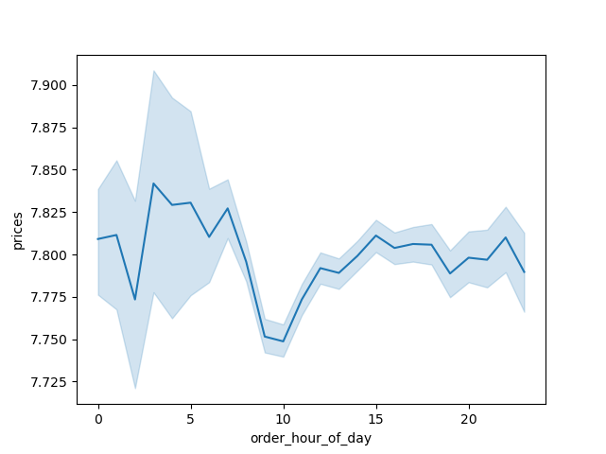
- Spending behavior per hour
- Prince tag grouping
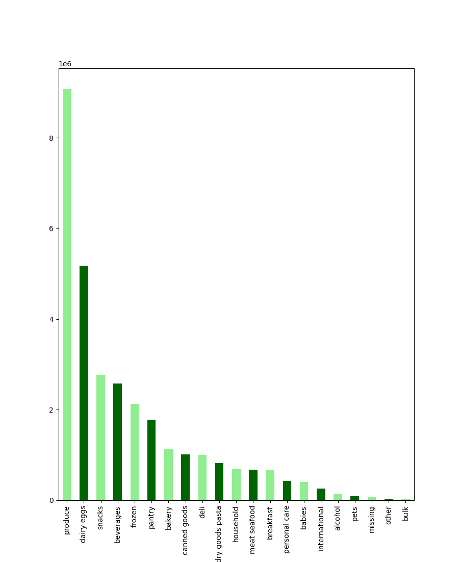
- Popularity of products/ departments
- Customer profiles
1. The Analysis: Workflow
The learning stage:
1. Import data sets
2. Transposing data, creating a data dict, subsetting, wrangling
3. Data prep: clean datasets, consistency checks
4. Derive columns with loc function, If-statements with For-Loops
5. Grouping & aggregating columns
6. Create flag variables
7. Visualizations in Python
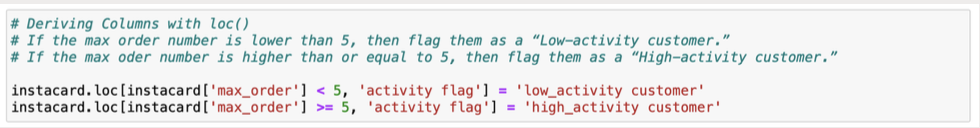
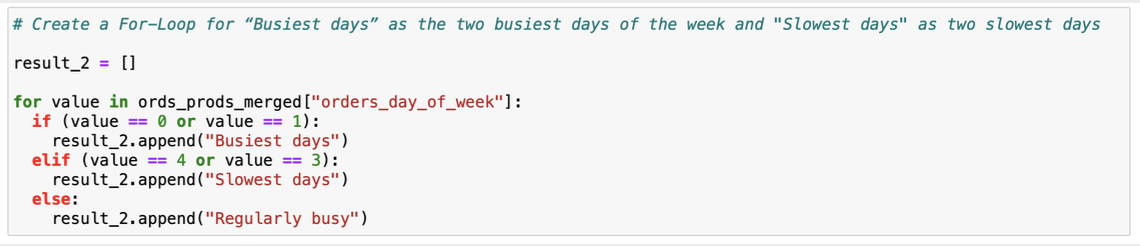 Code snippets to show loc-functions and a for-loop for creating flag variables
Final project deliverable:
1. Address any PII data
2. Comparing customer behavior in different geographic areas
3. Exclude low-activity customers via flag variable
4. Customer profiling
4.1 Visualization to show the distribution of profiles
4.2 Aggregating max, mean, and min variables on a customer-profile level for usage frequency and expenditure
5. Comparing customer profiles with regions and departments
5.1 Comparing visualizations
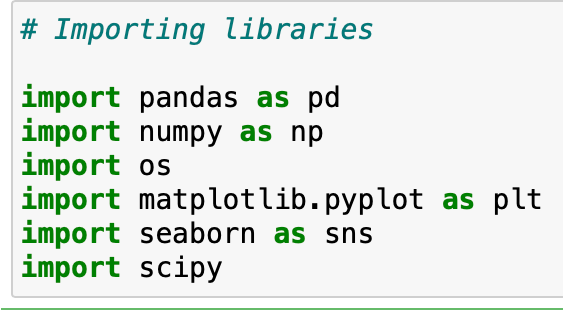
Using the following libraries:
2. The Analysis: Skill Examples
2.1 Comparing customer behavior in different geographic areas
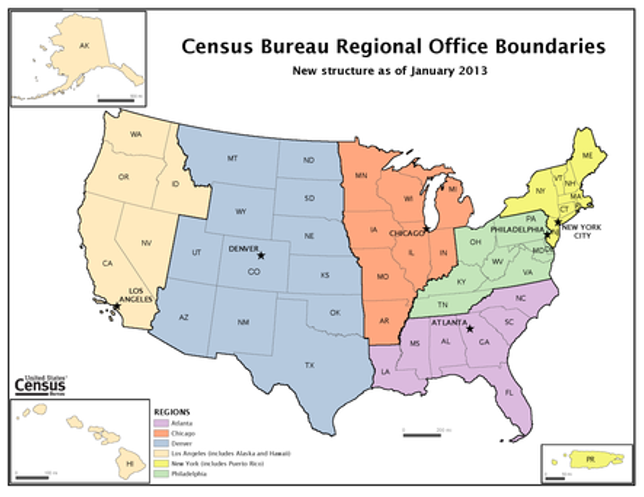
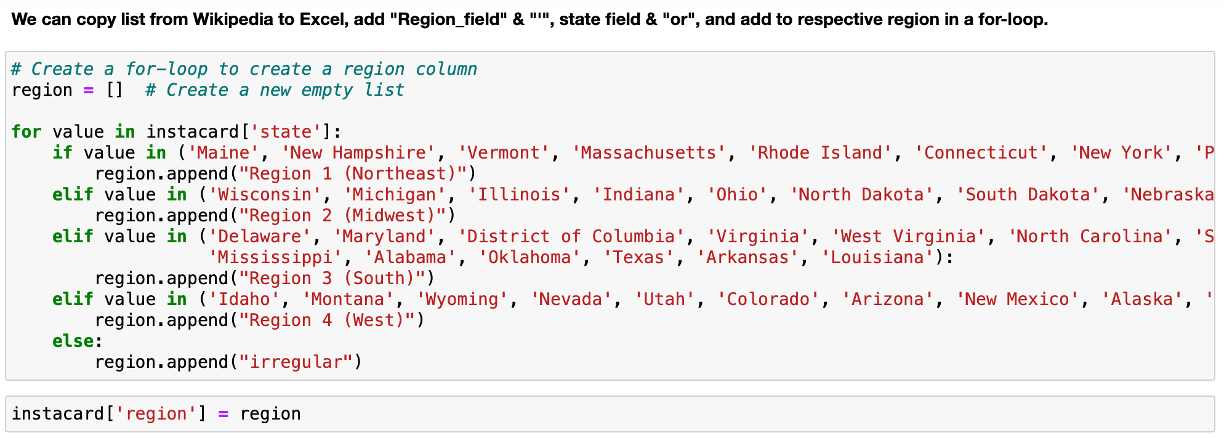
Instacart customers are all over the US, and I have the state residency information. How can I use this information to inform the customer segmentation? Solution:Create a regional segmentation of the data as a “Region” column based on the “State” column
(source: wikipedia: List of regions of the US)
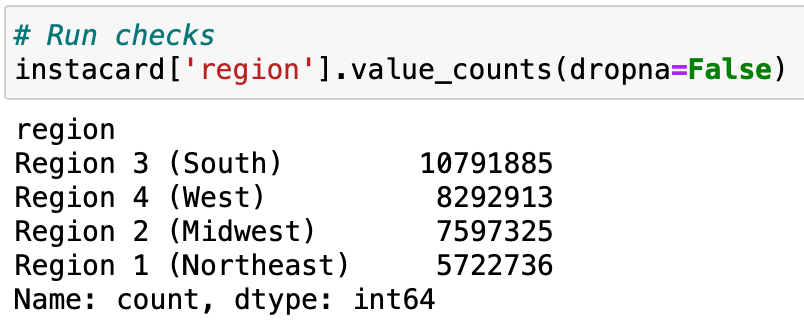
Creating region columns via For-loops:
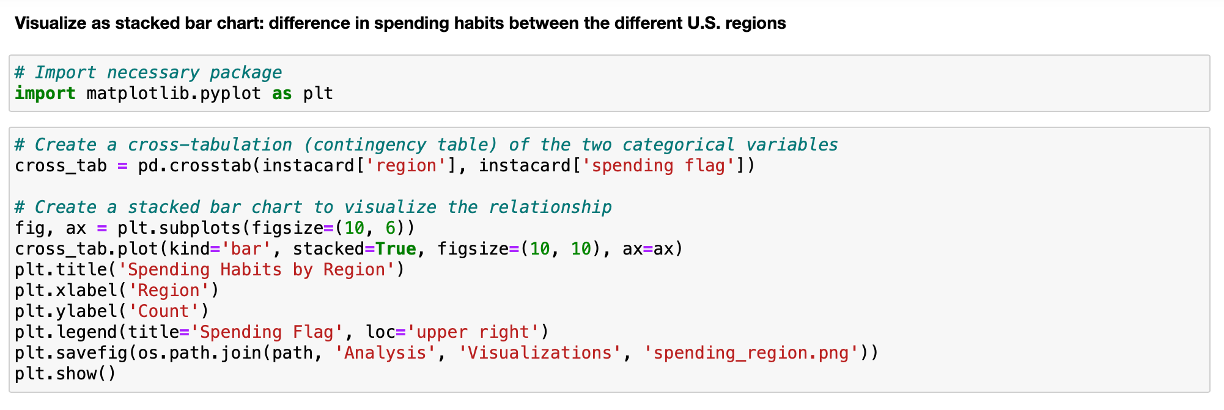
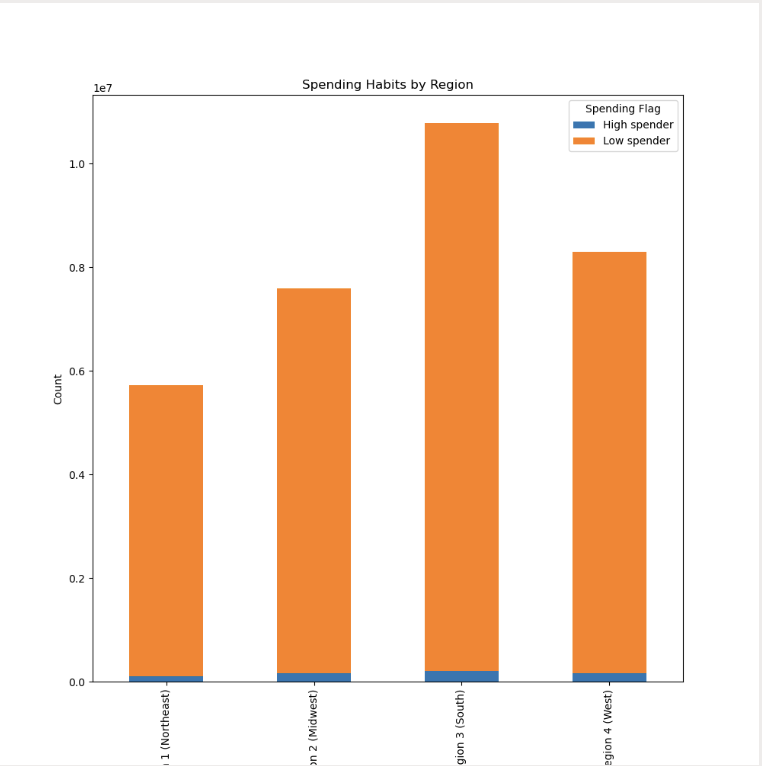
 Cross-table and stacked bar chart to visualize differences in high and low spenders:
2.2 Customer profiling
How can I cluster customers into profiles based on the provided information? Solution:Creating profiling variables based on age, income, purchased goods from departments, number of dependents, “orders_day_of_the_week”, and “order_hour_of_day” columns
Challenge:
Find the most informative cut-offs and combinations for profiles
Join the department column from a further data set
How can I cluster customers into profiles based on the provided information? Profile approach: Creating region columns via For-loops:
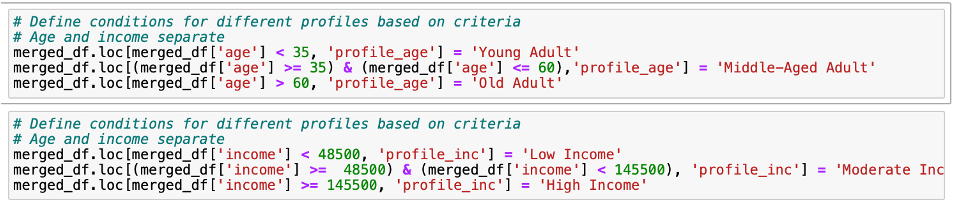
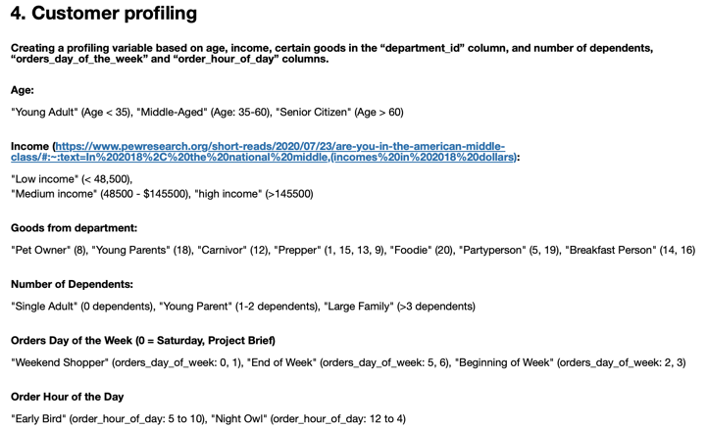 Python code example for creating profiles:
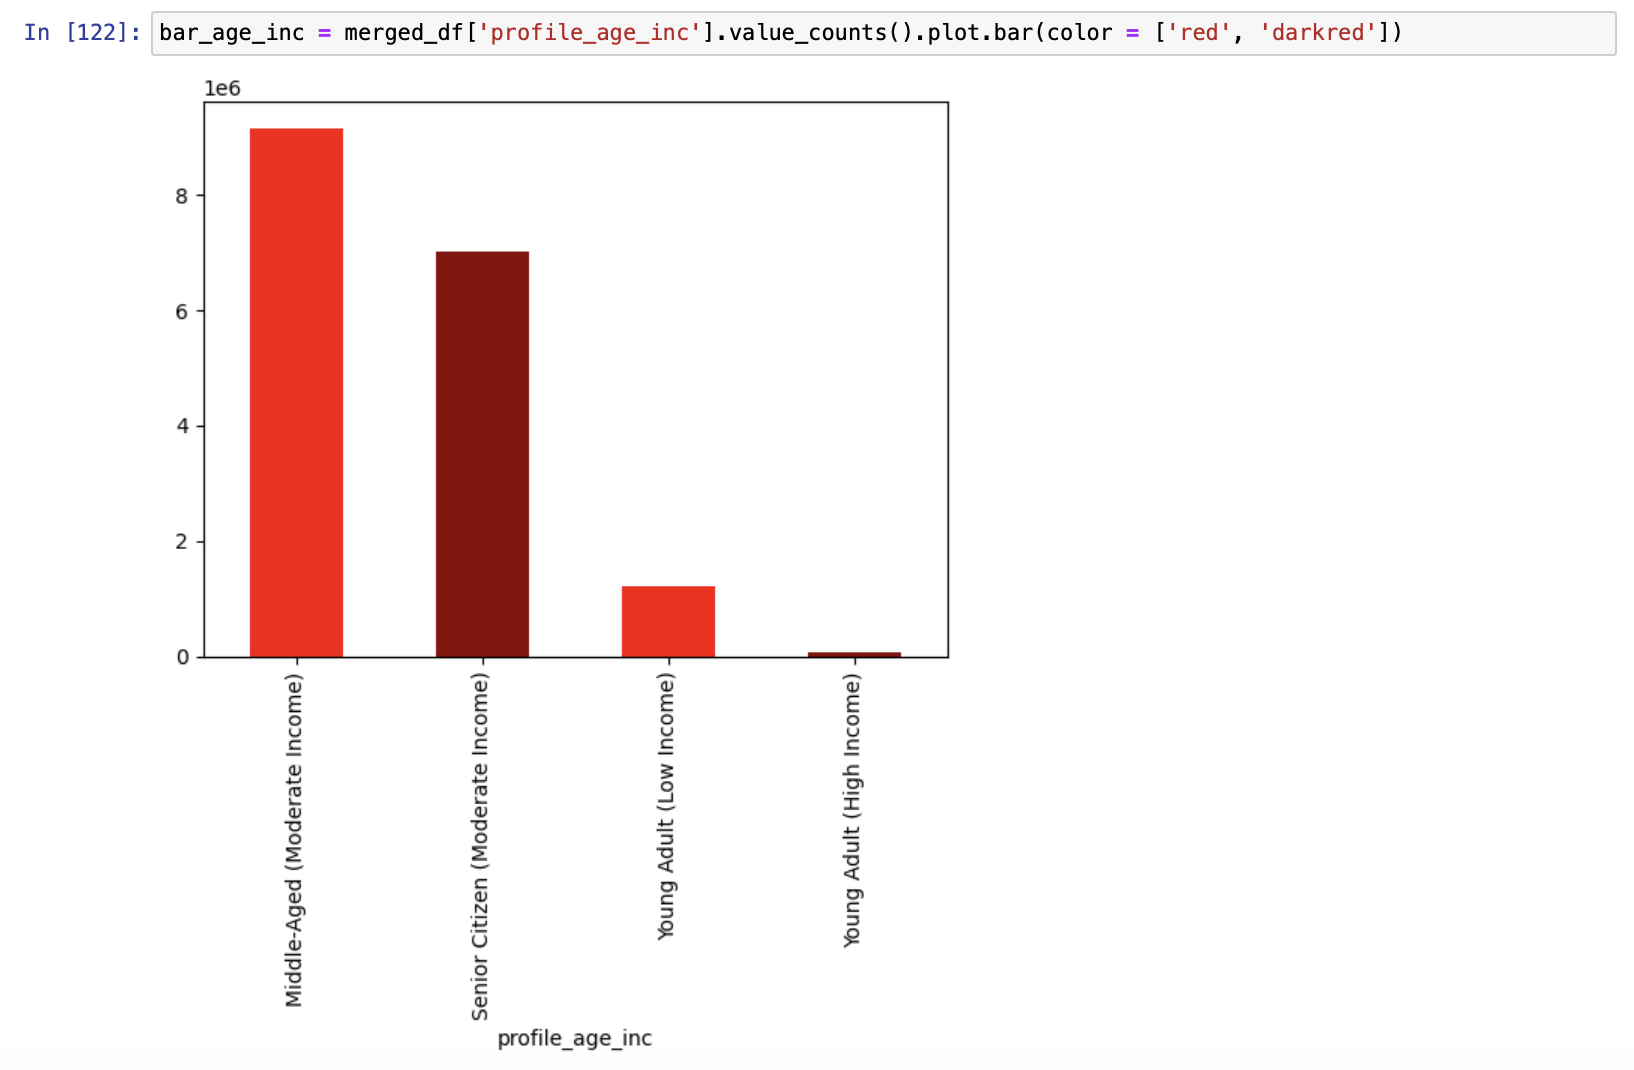
Visualization to show the distribution of profiles: Age
 Age & Income
 In retrospect, I would now apply unsupervised machine learning/clustering algorithms as a new approach to generate profiles to take the project to the next level.
3. Further selected results & recommendations
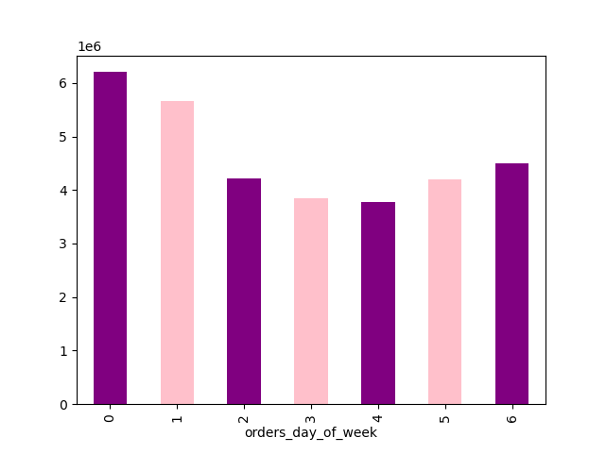
- Saturday is the busiest day, followed by Friday. Tuesday and Wednesday are the slowest days. On the busiest days, people also spend most money.
- Most purchases are made between 9 AM and 5 PM.
- People buy more expensive goods at irregular shopping times, speaking for impulsive expenditures at night.
- Recommendation: Concentrate on mid-day to advertise products with reasonable prices. Impulsive spending: think about an ethical business strategy.
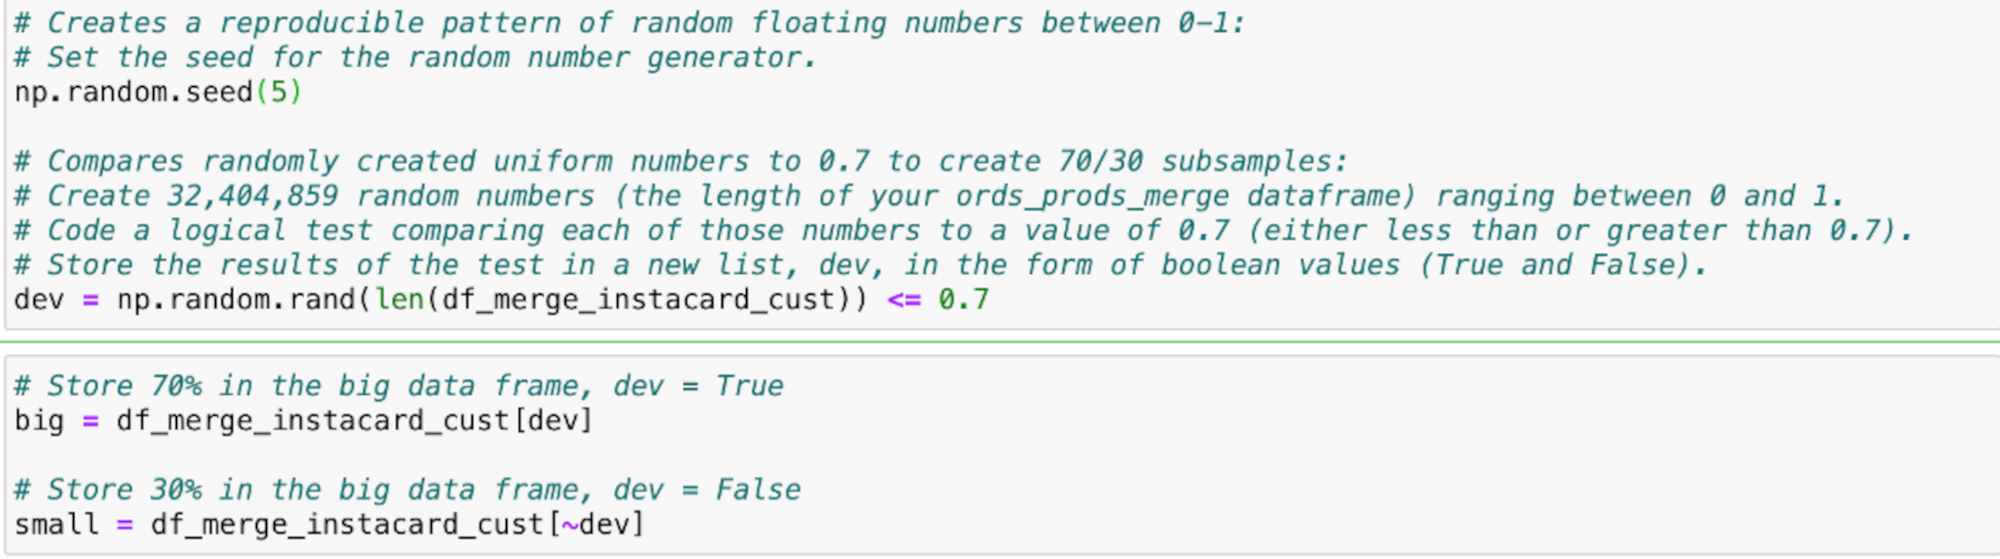
Challenge: To create a line chart, we need a subsample, otherwise we would run into RAM/CPU issues Solution: Create a random, reproducible subsample
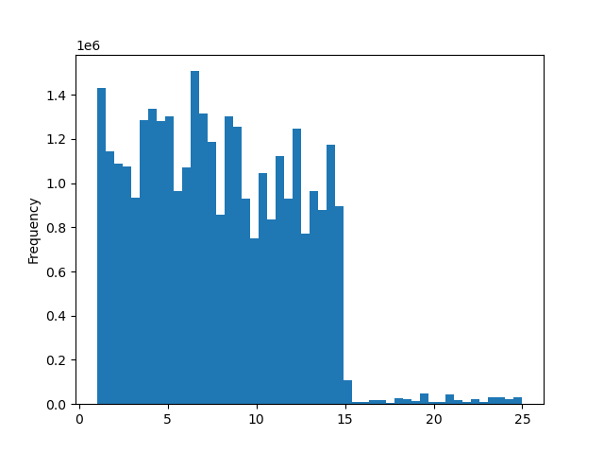
- Price density is highest among the range between 1 and 15 and is substantially lower above 15.
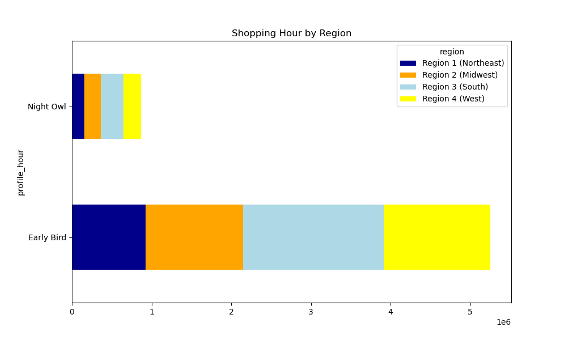
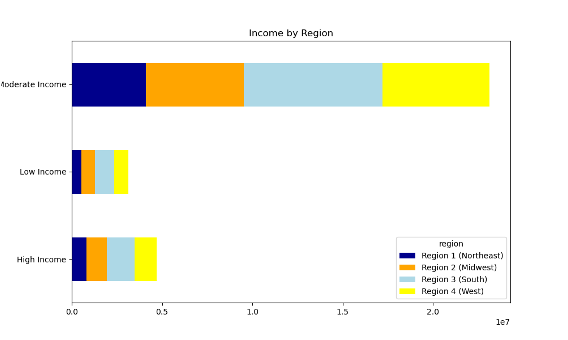
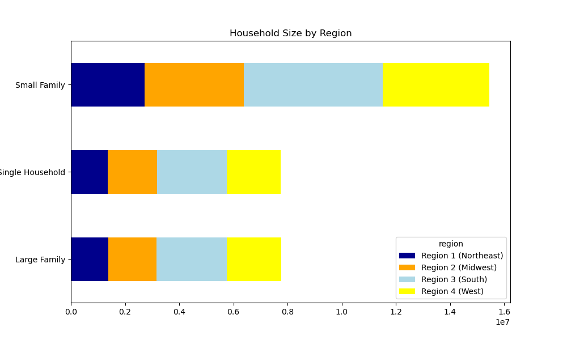
- Differences between regions seem marginal. Further analyses should target proportional differences regarding the number of inhabitants per region.
- The South is generally the most important region, with most "early bird" shoppers, the highest number of the most important customer group (middle-aged, moderate income), the biggest household size, most weekend shoppers, and most "preppers" and "breakfast persons" as most important profiles.
4. Conclusion
The project:
- Customer segmentation and targeted marketing campaigns seem reasonable considering that Instacart has customers from all US regions & states, different income classes, age ranges, household sizes, with differing product preferences…
- In a next step, I would revise and complement the customer profiles based on more research & stakeholder feedback, as differences between regions & relations to other variables seem marginal.
- My future analyses would target proportional differences regarding the number of inhabitants per region, and I would group the data by user id before creating profiles to have user profiles (instead of order profiles).