Exploratory analysis of GameCo’s video game dataset
It is October 2016 and GameCo’s executive board is planning the marketing budget for 2017. They’re assuming that sales for the various geographic regions have stayed the same over time, and they’ve asked the data analyst to look into the data to see if this is still true. If it's not, the marketing budget will need to be redistributed among the regions to maximize return on investment.

Objective:
Key Business Questions:
- Differential game popularity
- Main competitors per markets
- De/increased games‘ popularity
- Varying sales figures between geographic regions over time
The dataset
Open data set, retrieved fromTracks the total number of units of games sold (not financial figures) from 1980 to 2016.
Procedures:
- Excel:
- Data preparation
- Grouping, summarizing data
- Descriptive analysis
- Visualizing
- Stakeholder Presentation in PowerPoint
Analyses & Results:
Results & Recommendations:
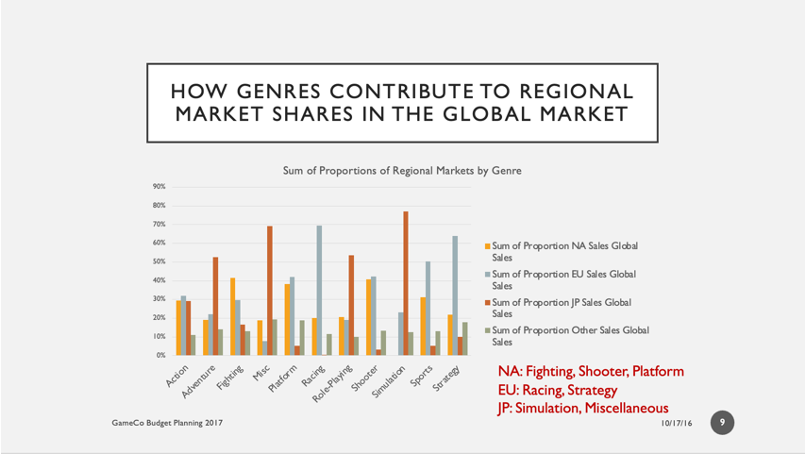
- NA: Fighting, Shooter, Platform
- EU: Racing Strategy
- JP: Simulation, Miscellaneous
Highly diversified, fluctuating markets
- Concentrate on the EU market and here, Racing and Strategy Games in budget planning for 2017
- Find out what makes the Japanese market special, invest in its particularities
- In general, dive deeper into the specificities of each market and diversify the marketing strategies accordingly
- Investment in deeper data analyses; for future data collections, more demographics of customers and data on customer behavior can help to observe and forecast regional and global trends